
Blog
Core Web Vitals Explained: The Developer Fix List
Core Web Vitals explained for developers: what LCP, INP, and CLS measure, the thresholds Google uses, and the fixes I ship on Laravel, Next.js, and WordPress.
Muhammad Zubair Akhtar
Core Web Vitals are three numbers Google collects from real Chrome users: how fast the main content appears, how fast the page answers a tap or a key press, and how much the layout jumps while it loads. I am Zubair Akhtar, a senior full-stack engineer in Lahore, and this is the list I work through when a Laravel, Next.js, or WordPress site fails one of them. It is not a glossary. Each metric gets a short definition, then the fixes I actually ship, by stack.
If you want the wider crawl and index pass first, that lives in my technical SEO checklist. Core Web Vitals optimization is one section of that list. This post is the long version of that section.
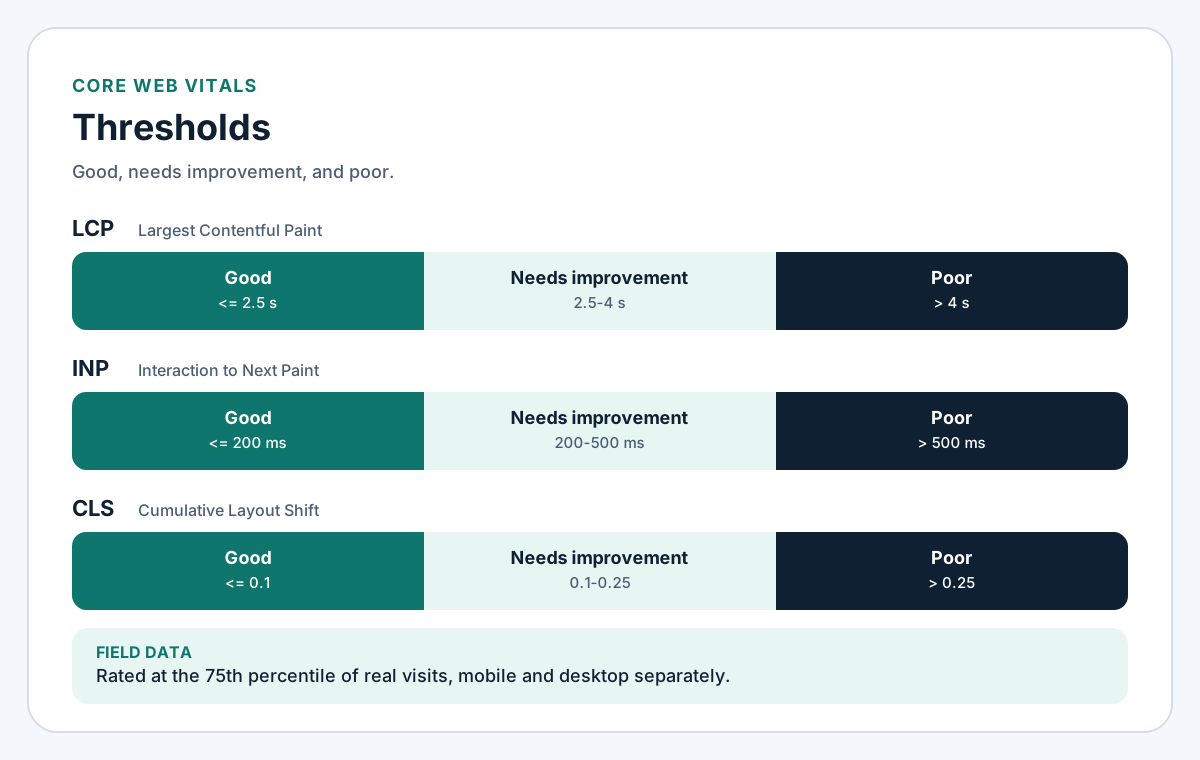
Figure 1. Core Web Vitals thresholds. Google rates a page on the 75th percentile of real visits, separately for mobile and desktop.
What Core Web Vitals measure
The three metrics and their thresholds
| Metric | What it measures | Good | Poor |
|---|---|---|---|
| LCP, Largest Contentful Paint | When the largest image or text block in the viewport finishes rendering | 2.5 s or less | over 4 s |
| INP, Interaction to Next Paint | The delay between a click, tap, or key press and the next frame the browser paints, close to the worst interaction on the visit | 200 ms or less | over 500 ms |
| CLS, Cumulative Layout Shift | How much visible content moves unexpectedly, scored on the largest burst of shifts | 0.1 or less | over 0.25 |
Anything between the two columns is "needs improvement". INP replaced First Input Delay as a Core Web Vital in March 2024. If an old report still talks about FID, it is measuring the wrong thing.
Field data decides, lab data explains
The number Google uses comes from the Chrome UX Report: real visits, a rolling 28-day window, and the 75th percentile. That is what Search Console's Core Web Vitals report and the top half of PageSpeed Insights show. A page passes when all three metrics are good at that percentile.
Lighthouse is a lab run on one simulated device. It is how I find the cause, not how I prove the fix. A normal Lighthouse page load has no user interaction, so it cannot report INP. It reports Total Blocking Time instead, which is a reasonable proxy for "the main thread is busy". When the lab says 98 and the field says poor, I believe the field. The users have slower phones than my laptop.
Collect your own field data
CrUX only has data for URLs with enough traffic, and it updates slowly. I add the web-vitals library on day one so I can see which template and which element is failing, not just which URL group.
import { onCLS, onINP, onLCP } from 'web-vitals/attribution';

function send(metric) {
  navigator.sendBeacon('/vitals', JSON.stringify({
    name: metric.name,
    value: metric.value,
    rating: metric.rating,
    page: location.pathname,
    // The attribution build names the element or script behind the number.
    attribution: metric.attribution,
  }));
}

onLCP(send);
onINP(send);
onCLS(send);
On Next.js, the framework exposes the same data through useReportWebVitals from next/web-vitals, in a small client component that is rendered once in the root layout.
LCP: make the main content arrive first
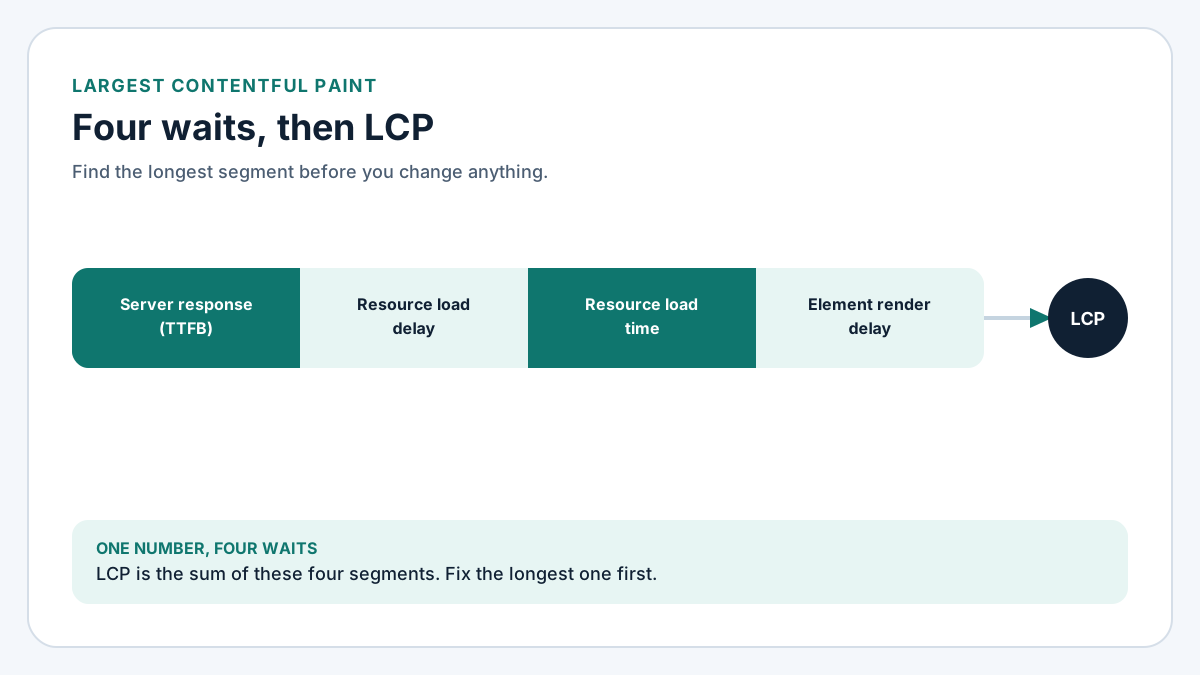
Figure 2. LCP is four waits in a row. Find the longest one before you change anything.
LCP is not one problem. It is the sum of four waits: the server's first byte, the delay before the browser discovers the LCP resource, the time it takes to download, and the time until the element actually paints. The attribution build of web-vitals gives you those parts. I fix the biggest one first.
Fixes that work on every stack
- Do not lazy-load the LCP image.
loading="lazy"on a hero is the most common LCP bug I find. - Put the image in the HTML as an
<img>. A CSS background or an image injected by JavaScript is discovered late. If it has to be a background, preload it. - Give it
fetchpriority="high", and give only that one image high priority. - Serve the size the device needs with
srcsetandsizes, in WebP or AVIF. A 2,400-pixel JPEG on a 390-pixel phone is wasted download time. - Cut server response time. Cache the HTML for guests, keep the server close to the audience, and put static files on a CDN.
- Do not hide the content behind a fade-in animation or an A/B testing script that keeps the page blank until it decides.
Laravel
Most slow LCP on Laravel sites I audit is server time, not the image. The fixes are boring and they work.
composer install --no-dev --optimize-autoloader
php artisan optimize
php artisan optimize caches the config, routes, events, and Blade views. Run it on every deploy, after the environment is in place. Check that OPcache is on in production. Then look at the queries on the page that is slow: an N+1 on a home page that lists twenty items is twenty extra round trips before the first byte leaves the server. For pages that are the same for every guest, a full-page cache such as spatie/laravel-responsecache, or the reverse proxy in front of PHP, removes PHP from the path.
For the hero, write the markup yourself in Blade:
<img
    src="{{ asset('images/hero-1200.webp') }}"
    srcset="{{ asset('images/hero-800.webp') }} 800w,
            {{ asset('images/hero-1200.webp') }} 1200w"
    sizes="(max-width: 768px) 100vw, 1200px"
    width="1200"
    height="630"
    fetchpriority="high"
    alt="Dashboard showing this week's orders"
>
If you want help with that layer, it is the kind of work I do under Laravel development services.
Next.js
next/image lazy-loads by default. That is right for most images and wrong for the hero. In Next.js 16 the priority prop is deprecated. Use preload for a single, obvious LCP image, or loading="eager" together with fetchPriority="high". Do not combine preload with loading or fetchPriority; Next.js throws an error.
import Image from 'next/image';

export function Hero() {
  return (
    <Image
      src="/images/hero.webp"
      alt="Dashboard showing this week's orders"
      width={1200}
      height={630}
      sizes="(max-width: 768px) 100vw, 1200px"
      preload
    />
  );
}
Two more checks. Render the page statically or cache it when the content allows it, because a server component that waits on a slow API delays every byte behind it. And keep the LCP element out of a client component that only shows up after hydration.
WordPress
Since WordPress 6.3, core adds fetchpriority="high" to the first large image it thinks is in the viewport and skips lazy-loading for it. Themes and page builders often break that: they print the hero as a CSS background, or run every image through a slider plugin that lazy-loads all of them. Check the rendered HTML, not the editor.
When a theme prints the hero itself, ask core for the right attributes explicitly:
echo wp_get_attachment_image(
    $hero_id,
    'full',
    false,
    array(
        'fetchpriority' => 'high',
        'loading'       => false,
        'sizes'         => '(max-width: 768px) 100vw, 1200px',
    )
);
Then fix server time. A page cache for logged-out visitors, a persistent object cache such as Redis for WooCommerce and membership sites, and fewer plugins running on every request. Page speed optimization on WordPress is mostly removing work the server should not be doing. That is the work I take on in WordPress development.
INP: give the main thread back
INP fails when the browser is busy running JavaScript at the moment a user taps something. The fix is almost never "a faster event handler". It is less JavaScript, and long tasks broken into smaller ones.
Fixes that work on every stack
- Show feedback first, then do the work. Update the button or show the spinner, yield, then run the heavy part.
- Break long tasks up. Any task over 50 ms blocks input.
- Load third-party scripts late: chat widgets, heatmaps, tag managers, and social embeds. Audit what each one costs on a real phone before you keep it.
- Avoid huge DOMs. A page with ten thousand nodes makes every re-render and every style recalculation slower.
function yieldToMain() {
  if (globalThis.scheduler?.yield) {
    return scheduler.yield();
  }
  return new Promise((resolve) => setTimeout(resolve, 0));
}

async function applyFilters(rows) {
  showSpinner();
  await yieldToMain(); // let the browser paint the spinner

  for (let i = 0; i < rows.length; i += 200) {
    renderRows(rows.slice(i, i + 200));
    await yieldToMain();
  }

  hideSpinner();
}
Laravel with Livewire, Alpine, or Vite
In Livewire 3, wire:model is deferred by default, so it waits for the next action instead of sending a request on every keystroke. If a search field needs to be live, debounce it:
<input type="search" wire:model.live.debounce.300ms="query">Keep Alpine components small and scoped to the element that needs them. With Vite, split admin-only or editor-only JavaScript into its own entry, so a public page does not download and run the dashboard bundle.
Next.js
Every client component ships JavaScript that has to hydrate before the page answers reliably. Keep 'use client' at the leaves: the button, the filter, the form. Leave the layout and the content as server components. For expensive state updates, mark them as non-urgent so React keeps the input responsive:
'use client';

import { useState, useTransition } from 'react';

export function ProductFilter({ products }) {
  const [query, setQuery] = useState('');
  const [filter, setFilter] = useState('');
  const [isPending, startTransition] = useTransition();

  const visible = products.filter((p) =>
    p.name.toLowerCase().includes(filter.toLowerCase()),
  );

  return (
    <>
      <input
        value={query}
        onChange={(e) => {
          setQuery(e.target.value);
          startTransition(() => setFilter(e.target.value));
        }}
      />
      <ProductList items={visible} dimmed={isPending} />
    </>
  );
}
Load third parties through next/script with strategy="lazyOnload" when they are not needed for the first interaction, and use dynamic() imports for heavy widgets that sit below the fold.
WordPress
Poor INP on WordPress is usually plugins: a slider, a popup builder, a page builder's frontend bundle, and three tracking scripts, all on every page. Remove what is unused, and load the rest only on the templates that need it. For your own theme scripts, WordPress 6.3 and later support a loading strategy on wp_enqueue_script:
wp_enqueue_script(
    'site-slider',
    get_theme_file_uri( 'js/slider.js' ),
    array(),
    '1.4.0',
    array(
        'strategy'  => 'defer',
        'in_footer' => true,
    )
);
Be careful with plugins that "delay all JavaScript until interaction". They can make lab scores look great while the first real tap waits for every script to download and run, which is exactly what INP measures.
CLS: reserve the space before the content arrives
CLS is the easiest of the three to fix, because every shift has a cause you can point at in the Performance panel.
- Set
widthandheighton every image and video, or a CSSaspect-ratioon the container. The browser then reserves the box before the file arrives. - Reserve a fixed slot for ads, embeds, and iframes. A YouTube embed with no height pushes the article down when it loads.
- Do not insert banners, cookie bars, or "download our app" strips above existing content. Overlay them, or put them in space that was there from the first paint.
- Match the fallback font to the web font so the text does not reflow when the font loads.
- Animate with
transformandopacity, nottop,height, ormargin.
Fonts on each stack
On Next.js, next/font self-hosts the font and generates a size-adjusted fallback automatically, so this is mostly solved if you use it. On Laravel and WordPress, self-host the font files, preload the one weight used above the fold, and define a fallback with metric overrides:
@font-face {
  font-family: "Inter Fallback";
  src: local("Arial");
  /* Tune these to your web font; the goal is the same line height and width. */
  size-adjust: 107%;
  ascent-override: 90%;
}

body {
  font-family: "Inter", "Inter Fallback", sans-serif;
}
The back/forward cache
When a visitor presses Back and the page comes from the browser's back/forward cache, it is restored instantly, with no new LCP wait and no layout shift. Pages with an unload event listener are not eligible. Remove those handlers, or replace them with pagehide. The bfcache test in Chrome DevTools, under Application, tells you why a page is excluded.
The order I fix things in
- Read Search Console's Core Web Vitals report. Note which metric fails and which URL group, on mobile first.
- Open PageSpeed Insights for one URL from that group. Use the field section to confirm the problem and the lab section to find the element.
- Fix the template, not the URL. One product template fixes a thousand product pages.
- Ship one change at a time, and watch your own
web-vitalsdata for a week. CrUX takes 28 days to fully reflect a fix. - Validate the fix in Search Console when your own data is green.
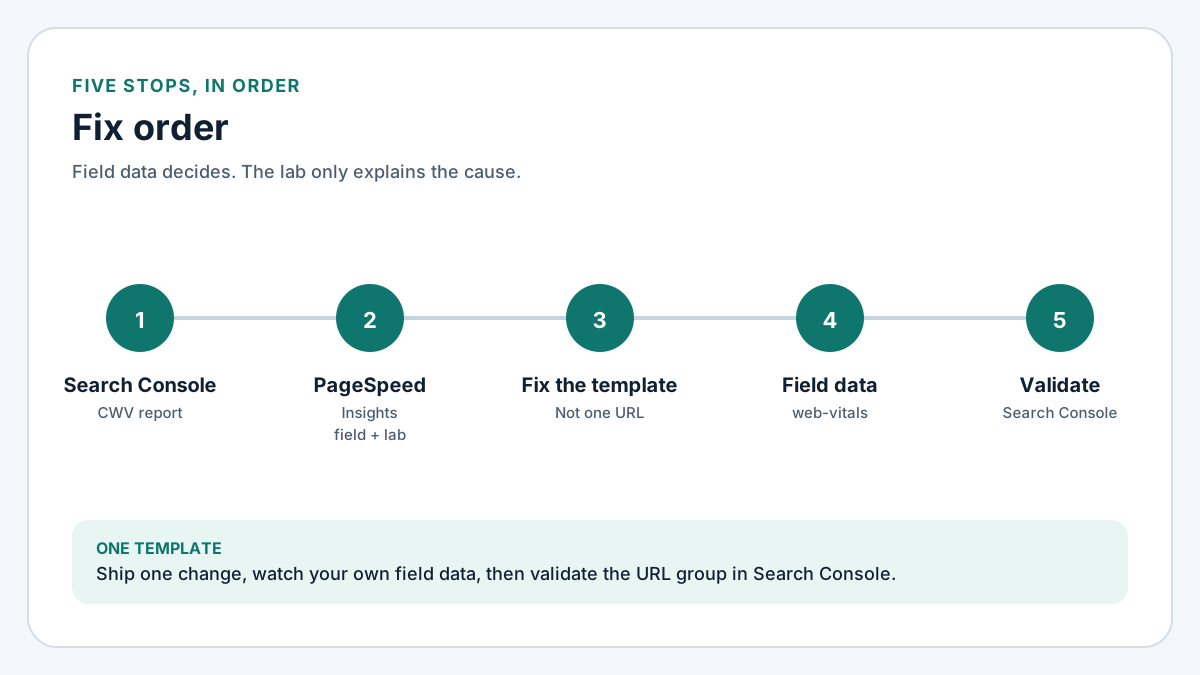
Figure 3. Fix the template, measure in the field, then validate.
Do Core Web Vitals affect rankings?
Yes, but as part of page experience, not as a lever that beats relevance. Google has been clear that good Core Web Vitals do not guarantee a top ranking, and a slow page that answers the query better can still win. I treat them the way I treat a broken canonical or a sitemap full of junk URLs: a technical problem that holds a good page back. Website performance optimization pays for itself in conversions before it shows up in rankings. A checkout that responds in 150 ms instead of 600 ms is worth fixing even if Google never looked.
FAQ
What are Core Web Vitals?
Three metrics Google collects from real Chrome users: LCP for loading, INP for responsiveness, and CLS for visual stability. A page passes when the 75th percentile of visits is good on all three.
What is a good INP score?
200 milliseconds or less at the 75th percentile. Over 500 milliseconds is poor. INP replaced First Input Delay in March 2024.
Why does PageSpeed Insights show a good lab score but failing Core Web Vitals?
The lab score is one simulated load with no interaction. The Core Web Vitals assessment is 28 days of real visits, on real phones and networks. Fix what the field data shows, and use the lab to find the cause.
How long does a Core Web Vitals fix take to show in Search Console?
The Chrome UX Report uses a rolling 28-day window, so a fix shows up gradually over about four weeks. Your own web-vitals data shows the change within days.
Which matters most for Core Web Vitals optimization: hosting, theme, or code?
On Laravel and WordPress, server response time is usually the biggest single part of a slow LCP, so caching and hosting come first. INP is almost always JavaScript, which means the theme, the plugins, and the client components. CLS is markup and CSS.
If you want me to fix yours
I audit and fix Core Web Vitals as part of my technical SEO services: the field data, the failing templates, and the code changes, on Laravel, Next.js, and WordPress. If the problem is inside the application, the work continues under Laravel development or WordPress development. Send me the URL and the Search Console report, and I will tell you which metric to fix first and what it will take.
If you are about to hire someone for that work, my checklist for hiring a Laravel developer is the same standard I would apply to myself.